
This article is all about the Oculus Debug Tool. I spent a lot of time trying to understand and test all the different settings and functionalities that the debug tool has and conclude the information in a digestible fashion. The topics covered in the article are:
- How to open Oculud Debug tool
- Oculus Debug tool settings (Tested & Explained)
- Troubleshooting issues
- Performance overlays
- Useful menu items
If that is something you are interested in, then I don’t think you will find a better resource on the internet. Get comfortable and let does dig in!
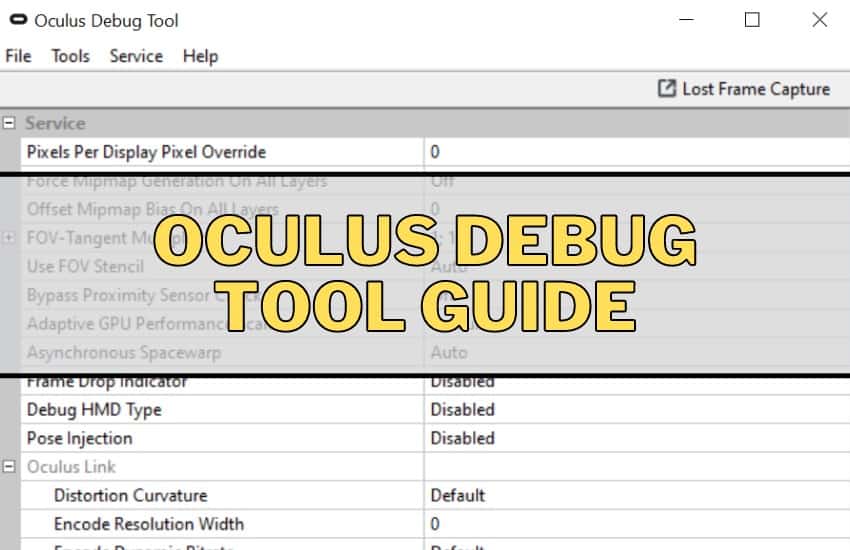
HOW TO OPEN OCULUS DEBUG TOOL
So you have seen or heard about Oculus Debug Tool and maybe some of the things you can do with it. But how do you find and open the debug tool in the first place?
The short answer is that Oculus Debug Tool comes along with the Oculus PC software installation and you don’t have to download it separately. If you didn’t change the default installation path during the setup, you will find Oculus Debug Tool located at “C:\Program Files\Oculus\Support\oculus-diagnostics“.
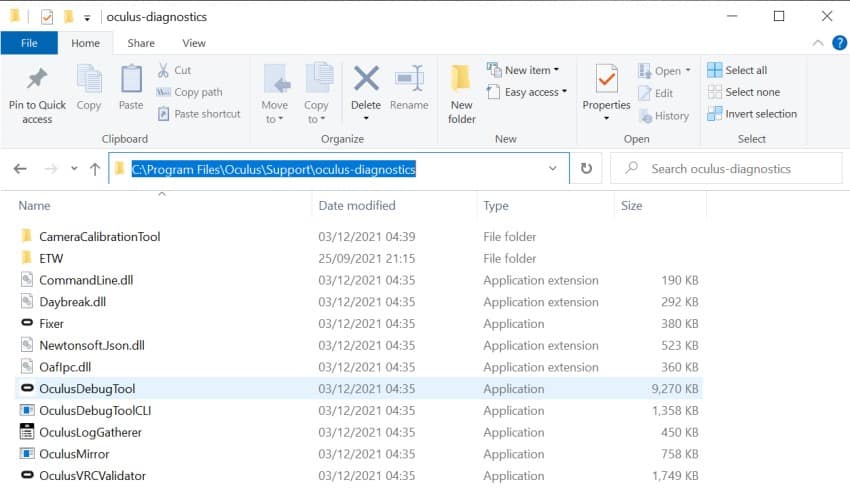
If you did change the Oculus software installation location but are not sure where exactly you ended up installing it, the quickest way to find out is to right-click on the “Oculus” application desktop shortcut and select “Open file location”. From there you will find the Oculus main installation folder and can navigate to the “Support\oculus-diagnostics” subfolder.
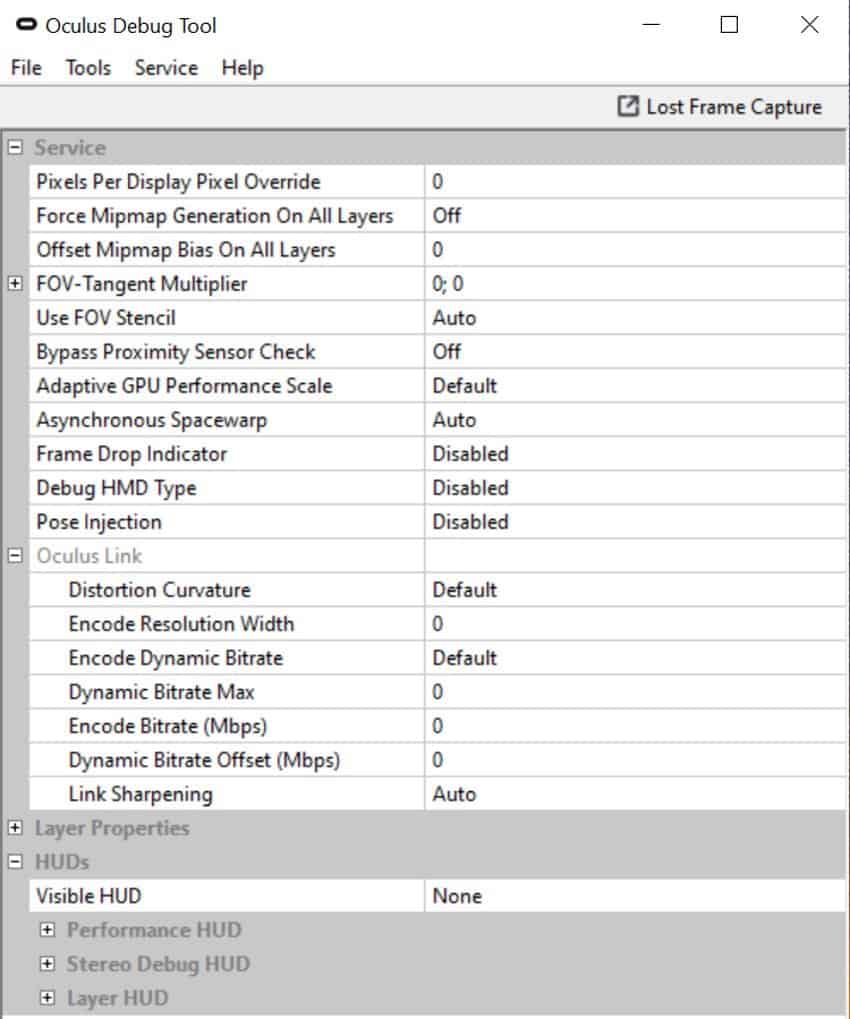
OCULUS DEBUG TOOL SETTINGS (EXPLAINED)
I am going to go over all the settings in Oculus Debug Tool and explain what they do and how you can use them. The settings are not be listed in the order that they appear in the application (instead I have put the more important ones to the top).
Note! When I personally tested all of the settings, I had inconsistencies in the way they applied (e.g settings that should take effect immediately, at one point did and then again didn’t for some reason). For this reason, when in doubt I recommend you restart the Oculus service (from “Service” menu item) and then try again.
Link Sharpening
Link sharpening is an image quality optimization method (implemented in Oculus v33) that automatically makes the visuals crisper, fine details clearer, and texts easier to read.
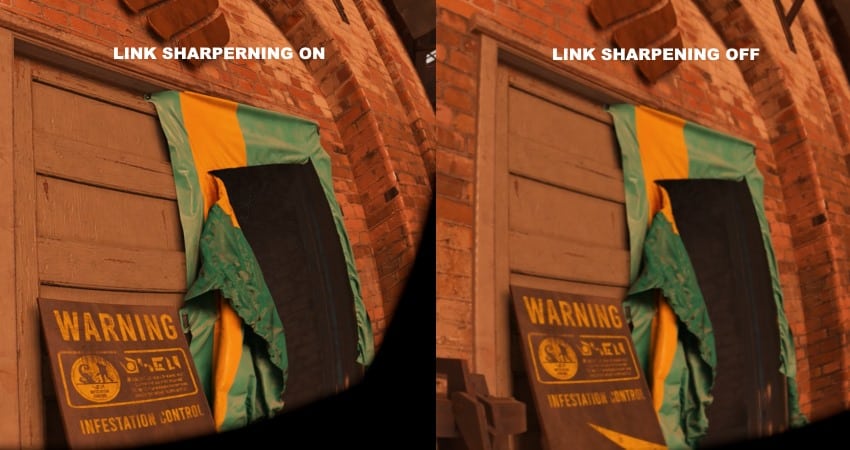
Since there is no performance penalty to this setting, I recommend changing the value from “Default” to “Enabled” to make sure it is always on.
Distortion Curvature
The Distortion Curvature setting controls the balance between pixel density in the center versus the periphery of your view. Setting the value to “High” gives more pixel density in the center whereas “Low” reduces distortion on the border of the lenses and thus gives more clarity in the periphery of your vision.
Since preferences are different then here you will have to test out which feels better and more natural for your personally. For me, clarity in the center of the image (setting value to “High”) feels better.
Encode Resolution Width
The Encode resolution width setting allows you to increase or decrease pixels displayed in the output image you will actually see. The default value (0) means that Oculus will automatically adjust the value based on your PC capabilities and whether you are using wired Link or Air Link.
For high-end PC-s, if left to default, the value will be automatically set to approximately 3600 for Oculus Link and 2800 for Air Link. You can try to play around with the setting and raise it up to a maximum value of 4064 for improved visual fidelity.
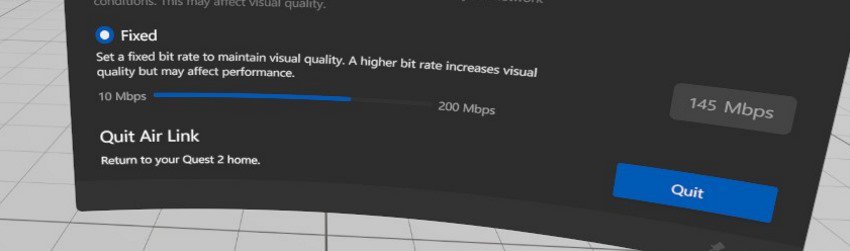
Encode Bitrate (Mbps)
Encode bitrate shows the throughput of the encoded Link video stream (in megabits per second) that is sent from your PC to your headset. The higher the value (maximum is 500), the less noise and artifacts you will see in your VR image (especially for the more complex scenes).
Although the setting applies to both Air Link as well as wired Link, I only recommend using it for the latter. If you want to change the bitrate for Air Link you should do that from the Air Link home environment (see my youtube video).
The default value of the setting is 0, which means that Oculus will automatically detect the optimal value (which is somewhere around 130Mbps for wired Link). Try testing values in the 100-500 range and see if you can improve the quality and/or performance of your VR experience.
Encode Dynamic Bitrate
With the Encode Dynamic Bitrate set to “Enabled”, Oculus will adjust your real-time bitrate dynamically (based on your network quality and congestion). If you disable the dynamic bitrate, Oculus will remember this choice (not reverted after restart) and will try to maintain the value you have set in the Oculus Air Link home environment under the “Fixed” bitrate.
Dynamic Bitrate Max / Dynamic Bitrate Offset (Mbps)
With the dynamic bitrate max setting, you can override the dynamic bitrate value set in the Oculus Air Link home environment. So regardless of what you have set in the Air Link home environment, the maximum bitrate value will be taken from Oculus Debug Tool.
The dynamic bitrate offset (Mbps) raises the actual real-time bitrate value by the number you set here. So let’s say that in a normal scenario your bitrate is around the 60-80 Mpbs area. If the offset value is set to 20, Oculus will now instead try to maintain a bitrate value of 80-100Mbps.
Pixels Per Display Pixel Override
This setting allows you to override the pixels per display pixel ratio to either supersample or downsample the rendered image. The setting changes apply immediately and there is no need to restart Oculus services.
In the earlier times of virtual reality, when the native resolutions of headsets were much lower (e.g the original Oculus Rift CV1 had 2160×1200 resolution), supersampling was a good way to increase the overall clarity and sharpness of the image.
Things move fast and with the Quest 2 (3664 x1920 resolution), you have to max out the render resolution in the Oculus PC software (5408 x 2736) to get the final image displayed approximately at the native resolution of the headset. Very few top-end PCs are able to maintain a stable performance at this resolution and a 90Hz refresh rate for example.
For this reason, if you are not able to max out the render resolution with your preferred refresh rate, there is no need for you to adjust the “pixels per display pixel override” setting. If your render resolution is maxed out and you want to further improve the image quality by supersampling, try raising the value slightly (e.g starting with 1.1).
Note! If you are confused about rendering / native resolution and how they relate to each other, I have explained this in more detail in my previous article Air Link Resolution & Quest 2 Quality Settings (Explained)
FOV-Tangent Multiplier
The FOV-tangent multiplier setting allows you to adjust the horizontal and vertical rendering field of view. By reducing the default values (1.0), you will lose visibility on the edges of your screen while potentially making significant gains in the overall performance.
The setting might very well be one of the most underrated settings of the Oculus Debug tool that practically nobody is talking about. If you want to know more, I created a video where I explained the FOV-Tangent multiplier and its effect on VR performance in greater detail.
And yes, I do acknowledge that the field of view of current VR headsets is already limited as it is. However, people are much less sensitive to the vertical FOV for example, and cutting it down by 10% (setting the value to 0.9 in Oculus Debug Tool) I doubt you will notice it much.
For sim racing, where you mostly focus on the center of the screen anyway, I was personally very comfortable playing at 0.8x horizontal and 0.5x vertical field of view. This way I could actually max out the rendering resolution of my Quest 2 and play Dirt Rally 2 at 90Hz with my gaming laptop. That’s pretty impressive if you ask me!
If you are the type of person who feels that the field of view is too narrow already, then this setting is probably not for you. However, if you value detailed graphics over the field of view or you are running on a below-average PC, I definitely recommend you fiddle around with this setting. You might be surprised!
Asynchronous Spacewarp
For those that don’t know, asynchronous spacewarp (ASW) is a programmatic frame-rate smoothing technique that kicks in automatically when your system isn’t able to maintain the target frame rate. It works by extrapolating (guessing) every other frame using computer algorithms.
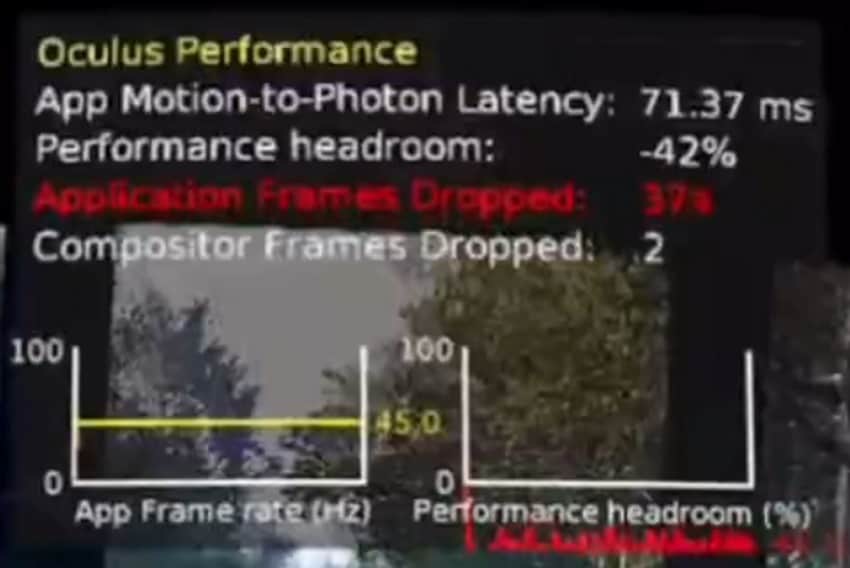
You can check whether ASW is active or not by enabling Oculus performance overlay When using the “Performance Summary” heads-up display if the “App frame rate (Hz)” is exactly half of the target frame rate this means that asynchronous spacewarp is currently active.
I generally recommend keeping the Asynchronous Spacewarp setting configured to “Auto”. However, you should try to optimize your VR settings in a way that you have enough performance headroom and ASW is never activated. Because although ASW does a pretty good job generally, the gameplay is just much more natural and smoother without.
If you can’t manage to optimize your settings enough with the link I gave earlier, try the FOV “hack” solution to boost your VR performance. Or maybe, depending on the game and your personal preferences, playing with ASW active is not a problem at all. You have to test it out for yourself and see what suits you best.
Mobile ASW
Mobile ASW, also called Air Link Framerate Insurance (AFI) is a frame-rate optimization technique for Meta Quest 2 that kicks in when general network degradation and/or spikes happen during an Air Link session.
If your network performance for Air Link is optimal, you should never see Mobile ASW (AFI) active. If however, you see high network transfer latency when measured with Performance HUD and don’t know the reason, it is worth enabling mobile ASW to see if it improves the overall experience.
Adaptive GPU Performance Scale
The Adaptive GPU performance scale setting allows you to disable adaptive resolution scaling in apps that support the functionality. When set to “Default”, some applications will dynamically lower the resolution to maintain the desired performance level.
By turning the GPU performance scale setting off, applications won’t adjust the resolution dynamically and when facing performance bottlenecks, you will see a drop in refresh rate and/or asynchronous spacewarp kicking in.
I recommend keeping the setting set to “Default”. Disable only if you have a high-end PC and you prefer maximum visual fidelity (at all times) over smooth gameplay.
Use FOV Stencil
Stencil buffers are used as a mask to tell the GPU which pixels to draw and which not. Most commonly stencils are used for special effects such as mirrors, portals, dissolves, fades, decaling, outlines and silhouettes, etc.
I tried to do some research to understand how this applies to the field of view exactly but I didn’t get any real answers. There used to be a black stencil bug for Microsoft Flight Simulator which could be solved by turning the “Use FOV Stencil” setting off. This however has been fixed and is not relevant anymore.
I didn’t find any other meaningful references to the “Use FOV Stencil” settings and didn’t see any differences when I personally tested it out, so I recommend leaving the setting to “Auto.
Frame Drop Indicator
When you enable the “Frame Drop Indicator” in Oculus Debug Tool, you will see the letter “F” displayed when application frames are dropped and “C” when compositor frames are dropped (bottom right of the display).
My recommendation if you want to measure frame drops is to enable the Performance Summary overlay or use the performance profiler functionality when you want to save and analyze the results. These two methods will give you much more accurate information compared to the frame drop indicator.
Bypass Proximity Sensor Check
There is a proximity sensor in both the Quest 2 headsets that detects whether your headset is worn or not. If you remove the headset from your head, the display of the headset automatically turns off.
The “Bypass Proximity Sensor Check” setting previously allowed you to override and disable the proximity sensor and keep the headset display turned on even if you removed the headset. However, based on my own testing and answers from forums, the setting does not work with Quest 2 anymore.
If you are interested in all the different ways that allow you to actually disable the proximity sensor, click on the link to read my article on this topic.
Force Mipmap Generation on All Layers / Offset Bias
Mipmaps are images/textures that are rendered at different sizes to deal with the fact that you constantly move closer and further from objects in VR. So the way mipmaps work is that when you initially see a full-size object and then start moving further away, it is automatically swapped for a half-resolution image of the same texture. The size is then cut half again when you move even further away, to offer the sharpest image for all scenarios.
You can read more about mipmaps from this developer-oriented Oculus blog article. For regular users, there is no need to change the “Mipmap Generation on All Layer” nor the “Offset Mipmap Bias on All Layers” setting. I actually tried and couldn’t see any difference anyway.
Debug HMD Type / Pose Injections
Debug HMD Type seems to be a redundant “leftover” setting from Oculus Rift CV1 which should be left disabled. And when I tried enabling “Pose Injections” in the Oculus Home environment, it froze my image until I disabled it again. I didn’t have much luck finding information on the internet about how it works either.
TROUBLESHOOTING DEBUG TOOL ISSUES
While you are testing out the Oculus Debug Tool settings, you might probably bump into a couple of problems (as I did).
If your Oculus Debug tool setting change seems to be not working, then I recommend that you select “Restart Oculus Service” from the “Service” menu items and try again. Also, make sure that after changing the setting value you are actually applying the changes by pressing “Enter” on your keyboard.
Another thing that might be confusing is that whilst some settings are saved (they will remain the same after you restart either Oculus services or your PC), other settings require you to change them each time you launch Oculus Debug Tool.
My last recommendation and problem I personally faced, is that when you are changing settings back and forth and then receive an error about not being able to apply the changes, go ahead and restart Oculus services and then try again.
PERFORMANCE OVERLAY
One key feature of the Oculus Debug Tool is that it allows you to enable performance overlays to measure your in-game performance metrics and optimize your VR settings or troubleshoot problems. I have actually made a video about this that you can watch below.
With the Performance Summary overlay, you can measure your overall latency, performance headroom and whether your PC is able to hold a steady refresh rate or ASW (Asynchronous Spacewarp) is kicking in.
The Oculus Link performance overlay, on the other hand, has proven to be very useful for me in debugging both Oculus Link as well as Air Link general performance issues (whether it is the USB cable/network or the PC causing the problems)
Note! If you want to know more and prefer reading, I have written a detailed article on how to enable and use Oculus performance overlays to optimize your VR experience!
RESET TO DEFAULT VALUES
Sometimes it might be the case that you have fiddled with various Oculus Debug Tool settings, trying to optimize your VR experience, but actually created a mess doing this. So how do you resume back to normal and set everything as it previously was?
There is no “Restore default settings” functionality for Oculus Debug Tool. In order to reset the settings to default values, start by manually setting all numerical values to 0. For settings with droplist values, choose either “Auto” or “Default” and then set all the rest of the settings to “Disabled” or “Off”.
Restart the Oculus service afterward (from the “Service” menu item) and you should have now successfully restored the default settings for the debug tool.
USEFUL DEBUG TOOL MENU ITEMS
In addition to the different settings you can manage from Oculus Debug Tool, it is also worth mentioning some of the most important menu items of the debug tool. These are functionalities I have personally used and they might probably also come in handy to you as well.
Performance Profiler
Like the name indicates, with performance profiler you can measure your game performance in real-time and configure which metrics you want to be displayed on the graph.
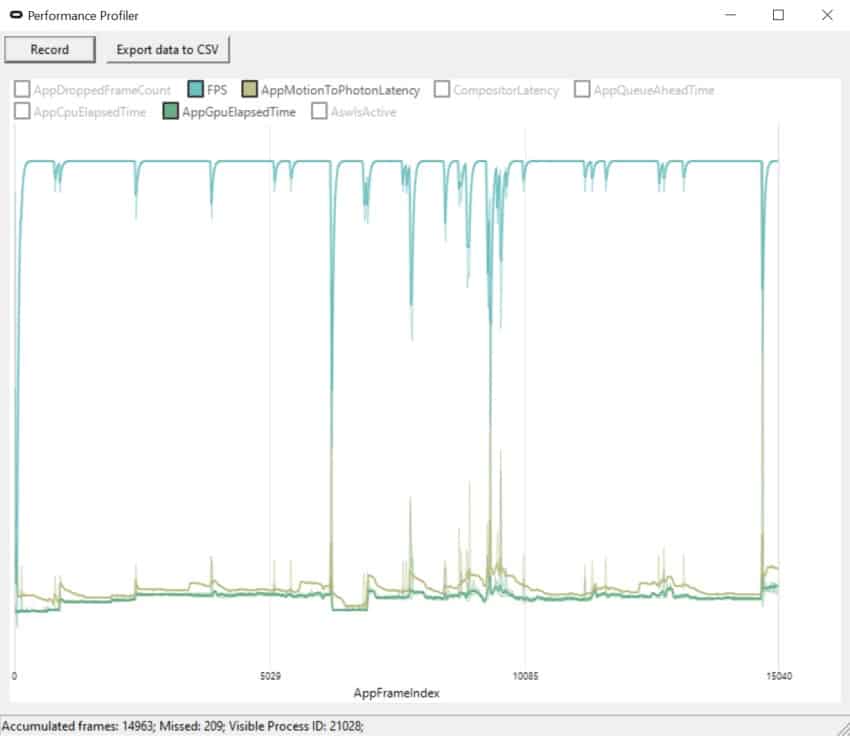
The more useful aspect of this tool is that after you have stopped the profiling process, you can save the results into a comma-separated value (CSV) file that you can then later edit by using spreadsheets.
This is also the method I personally used when I measured whether raising the OVRServer_x64.exe process priority has any impact on VR performance.
Mirror View
Mirror view is probably one of the easiest ways you can mirror your Air Link VR gameplay into your computer. This is very useful if you are not playing alone and want to bring your friends or family along for the ride and regular casting is not working for example.
Mirror view can also be used for recording your gameplay (using OBS screen capturer) and later uploading it to Youtube. For example, I recorded the clip below doing exactly that.
When opening the Mirror functionality from Oculus Debug Tool and right-click on the image, you only have limited options as to how to view the image (left, right, or both eyes).
What I recommend you do, is to find the Oculus Mirror application (located in the same subfolder as Oculus Debug Tool) and launch it from there. In this case, you can give the Mirror utility extra parameters on how you want to view the image (Window size, FOV, displaying notifications, etc).
For the screen capture above, I created a shortcut of the Mirror application and as the “Target” value I set the following:
"C:\Program Files\Oculus\Support\oculus-diagnostics\OculusMirror.exe" --Size 1920 1080 --FovTanAngleMultiplier 1.3 1.3 --DisableTimewarp --SymmetricFov --DisableFovStencil --IncludeSystemGui --IncludeNotificationsOne parameter I find especially useful is the FovTanAngleMultiplier which allows you to “widen” the field of view of the screen capture (which otherwise tends to be quite narrow). So if you are interested go ahead and test the Mirror application out and see if you like it and find use cases for it.
And that concludes my overview of the Oculus Debug Tool. I hope the article was useful and you learned some new things that you can test out to optimize your VR experience!
HARDWARE USED FOR TESTING AND WRITING THE ARTICLES:
* Meta Quest 2 (My “daily driver” headset, which I absolutely love & recommend)
* Lenovo Legion 5 Pro (AMD Ryzen 5 5600H, Nvidia Geforce RTX 3060, 16GB RAM)
* TP-Link Archer C6 (budget dedicated router for Air Link, see my full setup tutorial)
ESSENTIAL QUEST 2 COMFORT ACCESSORIES:
* VR Cover Foam Replacement (one of the easiest & cheapest ways to improve headset comfort)
* BoboVR M2 Head Strap (reduce pressure on your head and improve the overall fit of the headset)