
Looking for ways to measure and optimize your PC VR experience? In this case, you have arrived at the right place!
In this article, I am going to describe how you can enable and use different performance overlays (HUD) for your Oculus headset to measure latency, FPS, and other metrics. I am also going to give you different tips on what to look out for when interpreting the data and how to potentially improve your overall performance.
So let does not waste any more time and get right started!
Enable Performance Overlay (using Oculus Debug Tool)
In the context of this article, we are going to use Oculus built-in tools to display a performance overlay in VR games. More specifically, we are going to use the Oculus Debug Tool, which has several different types of heads-up displays available depending on your needs.
To enable performance overlay (HUD) for Oculus Link or Air Link:
- Open Windows Explorer (Windows key + E)
- Navigate to your Oculus installation directory (“C:\Program Files\Oculus\” by default)
- Open the “Support” directory and then “oculus-diagnostics”
- Launch the OculusDebugTool application
- Select “Performance” from the dropdown list for “Visible HUD”
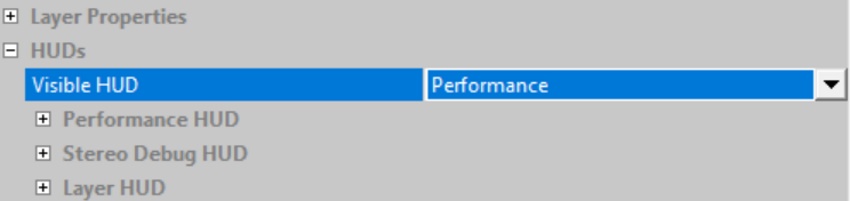
And it’s as simple as that! Now if you launch either a regular Oculus Link or a wireless Air Link connection, you should see a performance overlay displayed in VR.
It is possible to configure different types of head-up displays with different metrics, depending on what you are trying to measure and achieve. You can read more about the different HUD modes from the Oculus official performance head-up display manual.
Note! There are other performance overlays available as well. In addition to Oculus HUD, I quite often use fpsVR for SteamVR and also Virtual Desktop performance overlay to optimize performance and troubleshoot problems.
How to Use & Interpret Performance Overlay Data
Now that I have described how to enable the performance overlay, it would probably be a good idea to discuss the benefits and use cases for HUDs. I personally use the Oculus performance overlay for three main reasons:
- Optimizing settings & performance for specific games
- Testing out new performance optimizations methods
- Troubleshooting general performance issues
It has become a common practice for me that each time before diving into a new VR title, I enable the performance HUD to help me find the best balance between graphics and performance.
From time to time, I also use the Oculus performance overlay to test out different in-game / PC / network optimization methods that I find (to see if they actually improve anything). And finally, performance overlays have been hugely helpful for me when debugging general performance issues.
Performance Summary Mode (FPS, Latency, Performance Headroom)
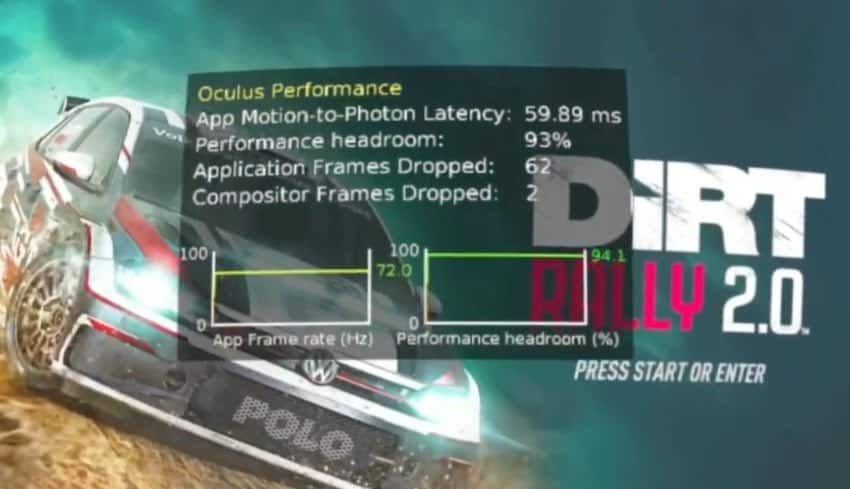
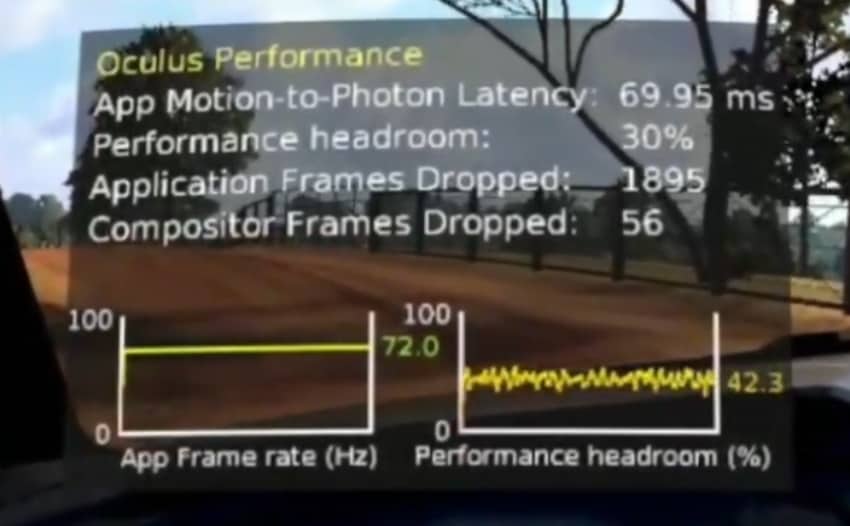
The Oculus performance HUD I tend to use the most is the “Performance Summary” mode. The most common scenario where I use this overlay is optimizing settings for any new VR game I start playing. You can see an example of how it looks from the screenshot below.
The values measured in the Performance Summary and how I personally use and interpret them are:
- App Motion-to-Photon Latency – the time it take for your physical movement to be actually displayed in the headset (delay in ms). When optimizing settings, I personally aim for the latency to be below 80ms at all times.
- Performance headroom – percentage of PC resources available that are not utilized by the application and VR compositor. For a smooth gaming experience, you should aim the performance headroom percentage to always be positive (around 10% area). Negative performance headroom almost always means dropped frames and lagging/stuttering in games.
- Application Frames Dropped – increases each time the application fails to present a new set of layers (eye textures that make up the frame) before the compositor is executed. Application frames dropped during game loading screens are fine. Intermittent (not regular) frames dropped during the actual gameplay are also OK and to be expected.
- Compositor Frames Dropped – increases when compositor fails to present a new rendered frame at V-Sync (Vertical Synchronization). A couple of compositor frames dropped from time to time (not regularly) are ok.
- App Frame rate (Hz) – The number of times the image is updated in your headset per second. To simplify things you can consider the frame rate to be equal to frames per second (FPS). I personally always aim for values to match the headset target frame rate. Occasional drops are OK (Oculus ASW is pretty good at “making up” dropped frames)
The way I usually approach optimizing game settings is that I start from the low-to-medium graphics. I then start raising the resolution and graphics step-by-step until I see latency going over the 80-90ms range and performance headroom regularly falling below 10%. At this point, I restore the last “good settings” that provided a stable VR experience.
Oculus Link Mode (Encode, Transfer & Decode Latency)
Another Oculus performance overlay I sometimes use is the “Oculus Link” mode. You can enable it by expanding the “Performance HUD” settings in the Oculus Debug Tool application and selecting “Oculus Link” from the dropdown menu. You can see an example of the overlay from the screenshot I have taken below.
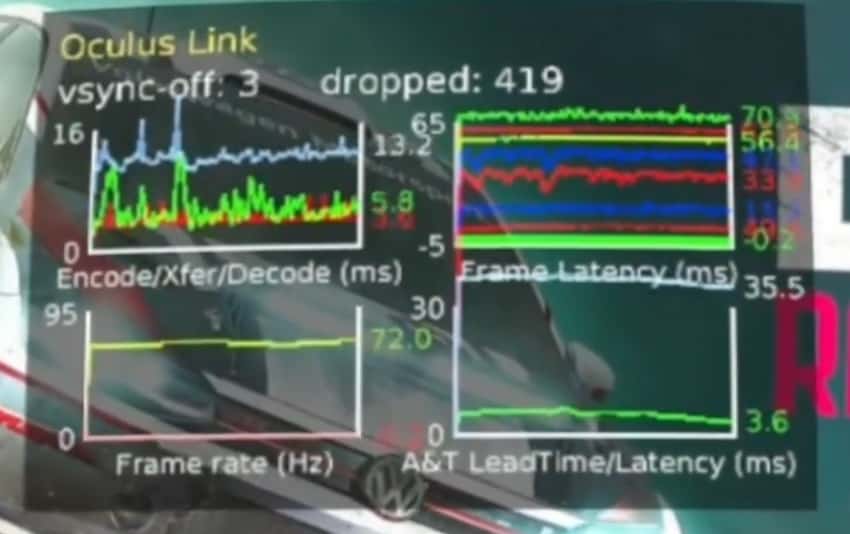
The sad truth is that while Oculus has documented all the other performance HUDs, this one is up for you and me to decipher and derive meaning from. There is no official documentation as to how to exactly read the graphs.
For this specific reason, I have been currently only been able to utilize the “Encode/Xfer/Decode (ms)” graphs, where the values correspond to:
- Encoding Latency (RED) – the time it takes the encoder (GPU) to receive the video frames and encode them.
- Transfer Latency (GREEN) – the delay for the compressed video to be transfered to the headset.
- Decode Latency (BLUE) – the time it takes to decode the compressed video in the headset.
If you are using Oculus Air Link, take note of the transfer (network) latency to understand how your router and network are coping with wireless VR streaming. Ideally, you should aim for a stable (no high peaks) transfer latency of around 5 ms. If you are struggling, I have written an article on how I achieved a low latency Air Link setup with a 40$ dedicated router.
High encoding latency usually means that your GPU (and CPU) are the bottlenecks. Check out various fixes and optimization tips from my previous articles here and here. You can also try reducing the bitrate which helps with both encoding and decoding latency (with the potential drawback of image quality suffering slightly).
Note! When you see your frame rate dropping to half of the actual target value (eg 90Hz showing as 45Hz), this means that frames are being dropped and ASW (Asynchronous Spacewarp) is kicking in and “guessing” and drawing every other frame using computer algorithms. Tune your settings down and/or find the bottleneck in your setup.
Optimize Performance & Eliminate Lag using HUDs
Seeing you reading this article, you are most probably trying to measure and/or optimize your current Oculus Link / Air Link performance. Using Oculus performance overlays, you can get a quantifiable measurement for each change you make to see if you actually improved anything or not.
You can find a large number of different fixes and steps to optimize Oculus Link / Air Link performance from my previous articles below:
- 13 Ways to Fix Virtual Desktop Lagging Issues – Ultimate Guide
- Oculus Air Link Laggy / Stuttering? (11 Ways to Fix)
- Oculus Debug Tool Guide for Quest 2 (Why & How To Use)
- Oculus Air Link PROPER Setup & Troubleshooting Guide
- Oculus Air Link Network & Wi-Fi Setup (7 Questions Answered)
- Here is How To Fix Oculus Link Lagging Issues (Oculus Quest 2)
- SteamVR Lagging With Oculus Quest 2 (Try These 11 Fixes)
Some of the steps and techniques in the articles are bound to overlap with each other. Pick out the ones that seem relevant to your specific scenario and then measure the changes using the performance overlay tips provided in the article.
Sometimes the improvements might be too little to notice just by looking at the real-time numbers in the overlay. If you want to be more scientific about measuring the effect of changes, Oculus Debug Tools also allows saving performance metrics to a CSV file (Tools → Performance Profiler).
This way you can later review all the performance metrics and calculate average and mean values which you can then compare against the base scenario.
HARDWARE USED FOR TESTING AND WRITING THE ARTICLES:
* Meta Quest 2 (My “daily driver” headset, which I absolutely love & recommend)
* Lenovo Legion 5 Pro (AMD Ryzen 5 5600H, Nvidia Geforce RTX 3060, 16GB RAM)
* TP-Link Archer C6 (budget dedicated router for Air Link, see my full setup tutorial)
ESSENTIAL QUEST 2 COMFORT ACCESSORIES:
* VR Cover Foam Replacement (one of the easiest & cheapest ways to improve headset comfort)
* BoboVR M2 Head Strap (reduce pressure on your head and improve the overall fit of the headset)